Werner A. Deutsch (Austrian Academy of Sciences, Acoustics Research
Laboratory) and
Franz Födermayr (Institute of Musicology, University of Vienna)
Frequency analysis of musical sounds came up to practical applications with the development of the Sound Spectrograph (Koenig, Dunn and Lacey, 1946). From the beginning much care has been taken to choice the frequency resolution and the time window properly in order to highlite important acoustical features as well as perceptual ones. It has been demonstrated by several studies (i.e. Potter, Kopp and Green, 1947) that the aural presentation of speech (and music) and its simultaneous graphic representation produces significantly deeper insight into the generation of acoustical signals and the ongoing perception as listening alone can provide.
Graf (1963) recognized the enormous potential of spectrographic analysis for applications in ethnomusicology. His theoretical concept assumes the acoustical signal to be the primary stimulus which is processed by the human psychophysiological system very much in the same way, even in different ethnic populations. What makes the various differences in interpretation, reception and perception under very similar acoustical stimulus representations prominent, is due to the influence of the so called social-cultural context in which music plays an important role.
The pertinent acoustic analysis of musical signals with acoustic laboratory methods (which today can be performed by using a specially equipped laptop computer.) produces basically a complete set of acoustical parameters which can be displayed as graphical images of the spectral content, i.e. the physics of the musical signal in real time or of those performances which have been recorded in advance. The analysis data can be used as input to comprehensive production models of voice( see: Fant, G. (1970) Acoustic theory of speech production. Mouton, The Hague; 2nd edition), musical instruments and musical ensembles. Sound source characteristics, tuning, musical scales, timbre, agogics, free field and room acoustics etc. can be observed on the analysis parameters extracted directly from the musical signal. Musical scales, vibrato, pulsato, beats are measured and detected on the basis of the fundamental frequency analysis data and their related spectral components, timbre is very much determined by the spectral envelope of the signals, duration and rhythms are mainly derived from the energy contour etc.
Whereas production models of the singing voice and musical instruments describe the acoustics of musical sound sources only, perception models deal with the signal processing of the listeners auditory periphery, its associated central pathways and cortical functions. It has to be admitted that psychoacoustics first started from an acoustical engineering approach in order to collect all technical basic data of the human auditory system, as selectivity measured in terms of absolute thresholds, difference limens in frequency, sound pressure level, signal duration and many other psychophysical functions. Most of the early psychoacoustical research was launched by telephone technical laboratories ( Fletcher, H. 1929, 1953), by the need to avoid noise and distortions on the telephone lines or for compensation of the hearing loss of listeners. Engineers, physiologists and neurologists have described the mechanics of the outer and middle ear, the hydromechanics of the inner ear ( Bekesy, G.v. 1960), the hair cell system and the resulting neural response up to the brainstem ganglions as well as acoustical evoked responses on the cortex. For technical and methodological limitations this early research has been done in most cases applying musically less relevant sinusoids, which could be controlled in experimental procedures with sufficient accuracy. This has been critisized frequently by musicologists for dealing rather with musicological non relevant aspects of sound and arbitrary functions of the auditory system instead of referring to the cognitive concepts of music.
Nevertheless, as the work in psychoacoustics progressed, the basic data obtained from the human auditory system contributed to a comprehensive theory of hearing, which today is capable to include highly relevant aspects of auditory localization, speech and music perception. Today psychoacoustical models explain complex perceptual functions, as musical pitch of complex tones, melody contours, consonance-dissonance, simultaneous masking, forward and backward masking, figure-background discrimination as well as Gestalt of musical rhythms etc.
Applying the psychoacoustic knowledge to spectrographic analysis of polyphony, the visualization of musical signals represents both, the graphical output of psychoacoustic perception models and the physics of sound. The spectral analysis of any arbitrary acoustical signal at a given instant is obtained by its Fourier Transform which produces a pair of real-valued functions of frequency, called the amplitude (or magnitude) spectrum and the phase spectrum. The amplitude spectrum stays moreover as a first approximation for the (neuro-) physiological representation of the signal in the human auditory system, the phase spectrum can be neglected for spectrographical purposes:
As the time variant signal goes on, many closely time windowed overlapping Fourier Transforms have to be computed at short successive intervals (< 30 ms) in order to produce a pseudo-3dimensional continuous graphic display of the sound, the spectrogram. In general narrow band frequency components with slow variations in frequency are detectable as horizontal frequency lines, whereas very fast changes or signal envelopes of a transient nature appear as vertical broad band bars in the spectrogram. Many musical instrument sounds (plucked strings, striked bars etc.) have a very short broad band attack and a narrow band slowly decreasing decay. Thus the onset of a note is easily identified, not so the end of the decay especially in reverberant environments).
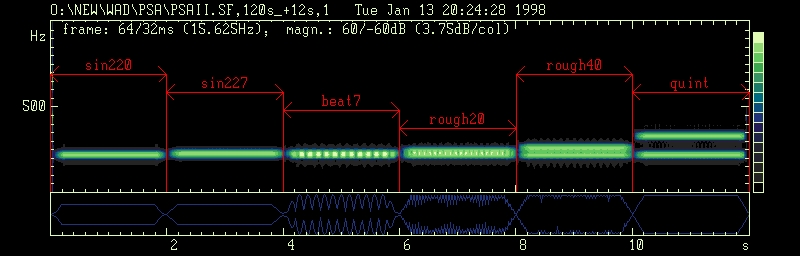
Beats: From left to right: simple tone 220 Hz, simple tone 227 Hz, two tone complex 220 Hz + 227 Hz with beating, two tone complex 220 Hz + 240 Hz (light roughness), two tone complex 220 + 260 Hz (roughness), two tone complex (musical fifth).
Usually directly incident or reflected waves from many sources, sounding simultaneously (musical instruments, singing voices etc.), are superposed at the listeners ear position, producing interference when components of equal frequency appear. Constructive interference takes place when the crests of two waves coincide, resulting the amplitude will be twice that of either wave. Destructive interference occurs when the crests of one wave fall on the troughs of the second and cancellation will be obtained. In case of interference of components slightly different in frequency beats can be perceived. The beat frequency is given by difference between the frequencies sounding together; beats can be detected on the spectrogram as periodic rise and fall in amplitude on a single (horizontal) frequency line. Whenever the frequency difference exceeds a certain value of 20 Hz no beating can be heard anymore and the perception of roughness is raised which has its maximum between 40 and 70 Hz. Increasing the frequency difference further on (see: critical bandwidth) produces two tone perception.
One of the most difficult phases in the investigation of spectrograms is the decision wether or not a spectral component of a signal which physically exists can be perceived by the auditory system and to what extent. The phenomenon that spectral components of a complex tone are not audible, despite their considerable amplitude measured, is described by the human auditory masking function. Masking is (1) the process by which the threshold of audibility for one sound is raised by the presence of another (masking) sound and (2) the amount by which the threshold of audibility of a sound is raised by the presence of another (masking) sound. The unit customarily used is the decibel (ANSI S3.20-1973). Masking may be seen as a general loss of information or as an undesired decrease of sensitivity of the auditory system but in contrary it is one of the most important auditory functions in order to perform the frequency analysis of the ear. Masking helps to process the sound into perceptual relevant components either belonging to the same or different sounds; it determines which components are resolved by the ear as audible harmonics with spectral pitch as well as it fuses higher harmonics according to the auditory critical bandwidth.
The critical band in hearing can roughly be described as that frequency band of sound, in between that two spectral components influence one another. This influence can be expressed in terms of masking, loudness summation, roughness, consonance, dissonance etc. The bandwidth of the critical bands remains constant with 100 Hz up to a frequency of 500 Hz and increases up to 17\% of the midfrequency value beyond 500 Hz. Consequently the distribution of the spectral components of any acoustical signal along the basilar membrane of the inner ear is best approximated by the Bark\footnote{according to the acoustician Barkhausen (1926). scale which corresponds to the frequency spacing of the critical bands. A formal expression for the computation of the Bark scale has been given by Zwicker and Terhardt (1980). The unit of frequency (f) is assumed to be in kHz, arctan in radiants:
As a result of the Bark transformation a much better frequency resolution in the linear low frequency range up to 500 Hz is obtained. The resolution is progressively reduced at higher frequencies. Spectrograms using the Bark scale represent the psychoacoustical frequency spacing of the inner ear and can be interpreted in terms of perceptual relevant spectral frequency distribution.
The transformation of the frequency axis into Bark scale and the extraction of irrelevant spectral components from the signal creates a so-called Relevance-Spectrogram which contains those frequency components only which evoke neurophysiological activity (SPL-Ecxess). It represents the signal associated to the neural excitation pattern in the auditory nerve, containing the relevant information parameters for the processing at higher neural levels. Thus the musical interpretation of spectrograms is highly facilitated as irrelevant signal parts can not show up. Moreover by applying an categorized intensity detection procedure (a concept of overmasking) the most prominent spectral peaks of the signal are extracted and figure-background discrimination can be obtained ( Deutsch \& Noll, 1993). This enables the listener to follow the leading voice without interference of the background signal in many cases.
The perception of pitch of complex tones has been a topic discussed extensively in psychoacoustics since the well known controversy beween Hermann von Helholtz and Georg Simon Ohm on one side and August Seebeck on the other. The problem, which is still an important question in hearing theories, started from Seebecks observation that the pitch of a complex tone with a missing fundamental still remains at the pitch level of the fundamental frequency. Ohms acoustic law followed Fouriers theorem and stated in contrary, pitches of frequencies which existe objectively (as components of a complex tone) can be heard only. Ohms acoustical law strongly supported Helmholtzs hearing theory according to which the partials of a complex tone are distributed along the basilar membrane (place theory) and resonance is responsible {Note: Helmholtzs experimental setup consisted mainly in resonators, he invented). His acoustical sources have been tuning folks. Seebeck used an acoustic siren, blowing air against the holes of a turning disk. By proper spacing of the holes a complex tone is produced without its fundamental frequency. for the mechanical stimulation of the hair cells. He explained Seebecks missing fundamental phenomenon by arguing nonlinearities in the inner ear would evoke the low frequency pitch, creating an objective product of nonlinearity (difference tone or combination tone between the higher harmonics) at the place of the fundamental frequency.
Modern pitch theory is based on the results of Georg von Bekesys and J. F. Schoutens work. Both have stimulated the research on pitch perception for about 50 years. Bekesys travelling wave theory is strongly supported by physiological experiments (Bekesy, 1960) and Schoutens (1940) observations on the residue pitch made evident, that the ear works in both domains simultaneously: in the frequency domain by means of hydromechanics with a far then perfect result of a Fourier Transform and in the time domain where any onset or even a slight change in the regular vibration of the basilar membrane is detected.
Fianlly pitch has been defined as that attribute of an auditory sensation in terms of which sounds may be ordered on a scale extending from low to high. The unit of pitch was assigned the mel (ANSI S3.20-1973). Thus pitch depends primarily upon the frequency of the sound stimulus, but it also depends upon the sound pressure and the waveform on the stimulus. The pitch of a sound may be described by the frequency or frequency level of that pure tone having a specified sound pressure level that is judged by subjects to have the same pitch.
The discussion on pitch perception came to an premature end when Terhardt (1974) published a model of pitch perception which includes both, the virtual pitch and the spectral pitch. He applied the concept of Gestalt perception, which in musicology frequently is understood to describe sequential melody contours only, on simultaneous sounding partials of a single complex tone. This enables the listener to still perceive the complex tone as a whole even when prominent components are missing (e.g. the fundamental frequency) or when their amplitude is as low that they can not contribute to pitch perception. Thus two general modes of pitch perception have to be encountered: the holistic mode integrating the partials of any complex tone to a good Gestalt, evoking virtual pitches and the analytic mode, focussing more on the spectral components of the sound and isolating individual partials of the complex tone as it is described by the concept of spectral pitch.
The following conclusions for the today work in pitch perception and music transcription have to be drawn:
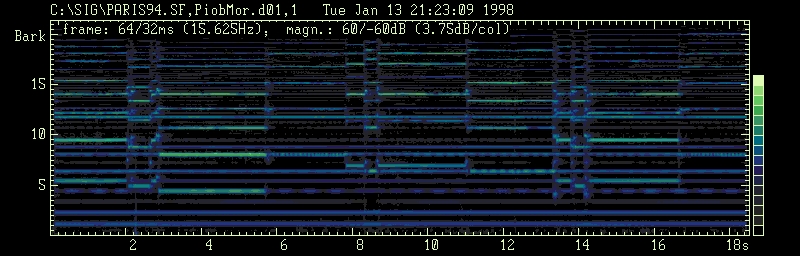
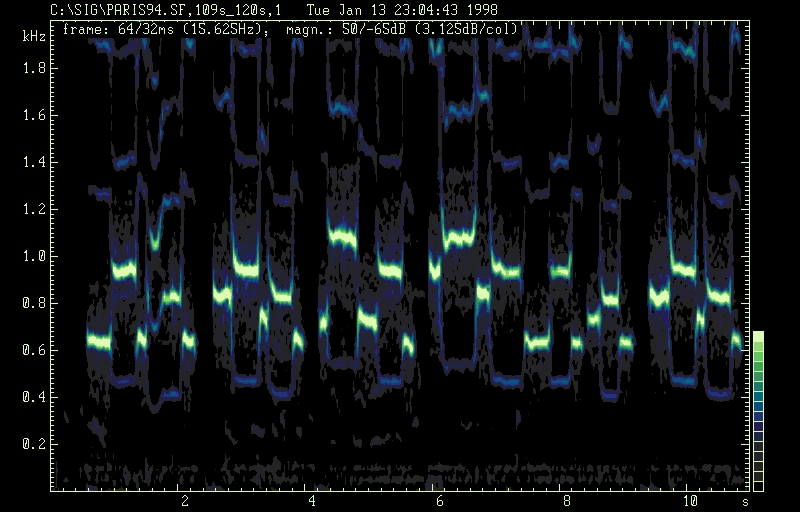
In the case of drone polyphony at least two psychoacoustical phenomena are generally relevant: masking and interference; the special characteristic of the drone sound is given by its relative stationarity in pitch and timbre throughout the total duration of the musical piece or a part of it, enabling melody tones to interfer with related spectral components of the drone. The following example is taken from a pibroch played on a Piob Mhor (highland bagpipe, Vienna Phonogramm Archive, Tape 17979, J. Brune, 1973). The key of the pipe chanter is usually spoken as A. The two tenor drones are tuned to the octave below the A of the chanter and the bass drone sounds an octave lower still ( Mac Neill, S. & Richardson, 1987). In our example the frequency value of /A/ is 116 Hz. The drone pipes produce a harmonic amplitude spectrum up to 7 kHz. Some partials show slow beats appearantly according to the slight mistuning of both tenor pipes. The ornamental sections of the sound probe are of equal overall duration (820 ms), whereas the sustained melody tones vary in duration from 1920 to 2830 ms. Interference is given mainly between the 4th, 5th, 6th and 8th harmonic of the drone and 1st harmonic of the sustained melody tones (/a3/, /c4 sharp/, /e4/, /a5/) depending upon their amplitude relation.
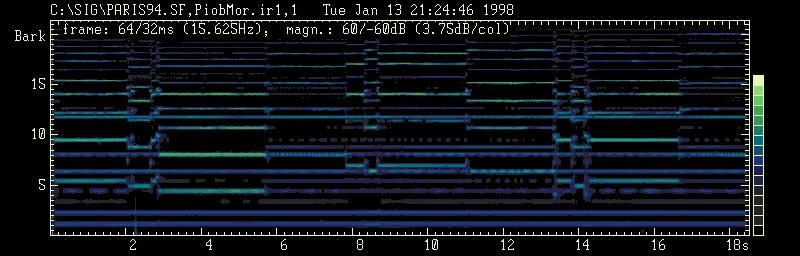
Piob Mhor: according to the irrelevance-threshold signal
processed, all spectral components below the masked threshold have been
extracted. Approximately 67% of the weaker FFT-amplitudes have been set
to zero.
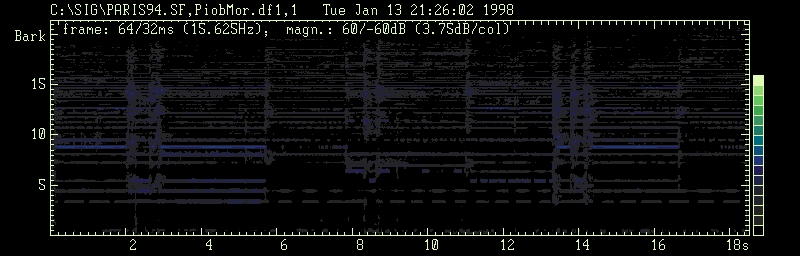
Piob Mhor: difference signal, 67\% of the weaker amplitudes
represent the signal below the masked threshold (irrelevance
threshold). After being extracted from the original
signal these components can be made audible again.
The superposition of this spectrogram and the 2nd exactly produces the
first spectrogram as well as the difference signal + irrelevance corrected
signal = original..
Generally the sustained longer chanter (melody) pipe tones interfere (11s to 16s) with higher harmonics of drone tones, alternating with notes having no interference with the drone (see 8s to 11s) and short melody tones constituing the melismes (at 2s to 8s, 14s). The occurence of beats at each 2nd harmonic of the drone spectrum indicates beating between the two tenor drone pipes with a frequency difference of 0.85 Hz. The beating between the 2nd and the 4th harmonic of the drone with a rate of approximately 1.7 Hz is not of most perceptual importance. This beating does not effect the overall drone sound dominantely. Perceptually more relevant is the beating between the partials of the drone and sustained melody tones seen at 2.6s to 6s, 11s to 13s etc.
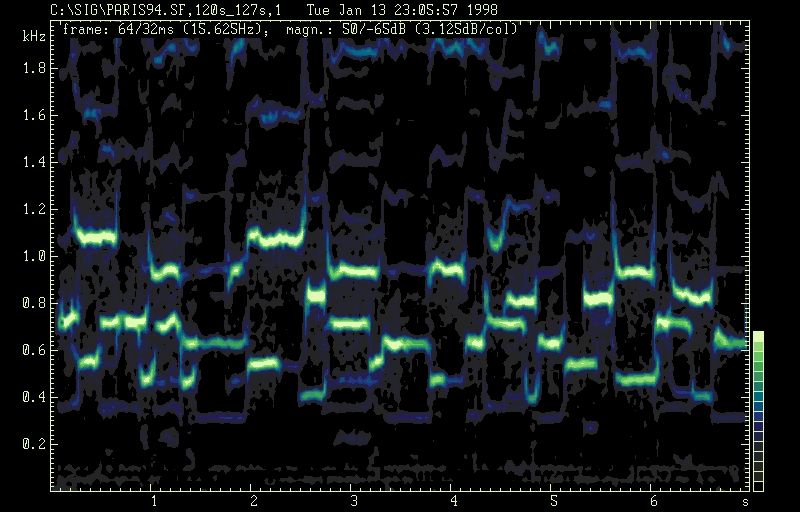
The interference of spectral components of both, the drone and the melody tones can be observed already on the spectrogram (fig. 1). Its perceptual relevance as indicated above can be seen in the relevance-spectrogram (fig. 2) from which the masked components of the signal have been removed. What happens to the signal when the masked threshold has been computed is demonstrated in the difference signal (fig. 3). From the lower harmonics of the drone sound, a2 and a3 are not affected by masking, as well as the 6th harmonic (e5). This results in a continous prominence of the fundamental and the fifth of the drone, the first corresponding to the basic tone of the melody, the second corresponding to the dominant tone of the melody. This fact has been mentioned already by Collinson (1970:167); Brune (1981:48) and MacNeill & Richardson (1987:32) but they all explained it by focussing on a strong 3rd harmonic of the bass drone. In contrary the example currently under investigation shows a very week 3rd harmonic of the bass drone and a strong, almost unmasked 3rd harmonic of the tenor pipes.
Several harmonics of the chanter pipes are stroger than the drone and consequently mask their neighbouring partials of the drone. The first partial of a4 of the chanter masks e4 and c-sharp5 of the drone sound and the first partial of e5 of the chanter masks c-sharp and g of the drone sound; whereas the sustained melody tones c-sharp5 and f-sharp5 themselves are partially masked by the harmonics of the drone sound. Taken together, the results of these observations provide psychoacoustical evidence (1) for the characteristic hierarchical structure given by the fifth a-e of the melody, which is strongly supported by the masking phenomenon. (2) The continuous sounding drone enlarges the overall frequency range downward, anchoring the melody into the tonal space.
The next example (fig.4 to 6) shows the role of roughness and frequency fluctuations (tremolo) as characteristics of a diaphonic type of Bulgarian multi-part singing (Messner, 1980:passim; Brandl, 1992; Födermayr & Deutsch, 1992:381-384). Masking has no effect in the region of the fundamental frequencies, even at the strongest partials (2 and 4) weak masking can be observed only. It does not influence the constituting elements of the sounds. Thus the partials of the individual voices interact with their full objective existent amplitudes. Throughout the whole piece a characteristic interval between two voices is produced, fairly constant with a width of three quarters of a whole tone. The resulting frequency differences between the fundamental frequencies are in the range of 30 Hz, evoking the sensation of roughness. Even when strong tremolo appears in Tressene figures, the average frequency difference remains close to 150 cents. Generally start and target points of exclamations fall on frequency values of the characteristic interval. The rate of the tremolo ranges between approximately 4 and 8 fluctuations /s which is known close to the ears maximum of sensitivity to frequency modulation.
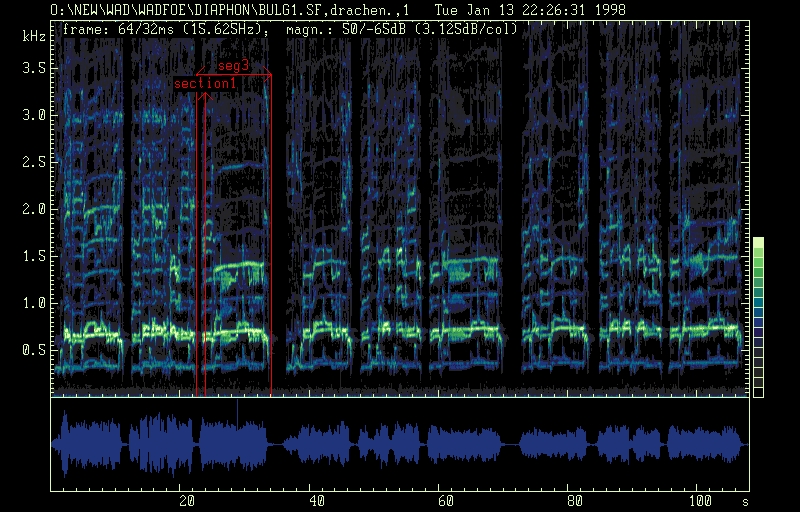
Long term spectrogram of Bulgarian multi-part song: Balkanton
BHA 2067, II 6. The duration of the piece is 39s.
The spectrogram shows the segmentation of the song
in 3 x 3 parts of equal duration.
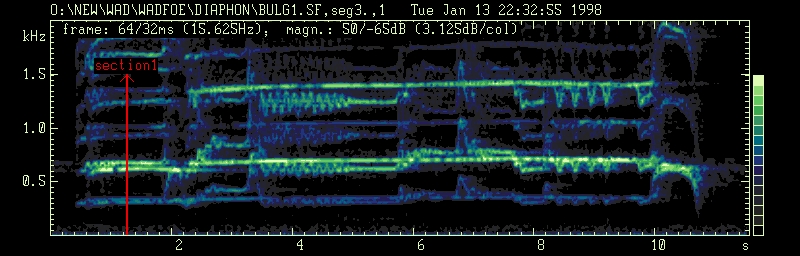
Segment No. 3 (8s - 13s) of Bulgarian multi-part song: Balkanton BHA 2067, II 6. The spectrogram shows the characterstic interval of 150 Cents, several exclamations and two tremolo of 8 and 4 Hz fluctuation rate
The sound of the drone instrument ( Tharisar, Födermayr, 1968) is characterized by a single pitched (233 Hz) harmonic spectrum with decreasing amplitudes. The recitation as well as the sung parts follow the fundamental frequency of the drone sound with distinct variations. Short quasi-stationary tones of the recitation have an ambitus up to several whole tones using the fundamental frequency of the drone as midfrequency value, those of the sung parts are asymmetric and clother to the drone frequency with intervals downwards to a semi tone and upwards to a third. The drone implements a tonal function as finalis of the song. Roughness is produced during the sung parts only due to the interference of the drone and sustained voiced tones.
Long term spectrogram: Epic Chant of the Kunkana, Gujarat (PhA B 12125). The first 3s of the sound example show the drone isolated, followed by drone and recitation (3s - 15.5s) and sung part segments (15.5s - 30s). This example demonstrates the special kind of voicing during the parlando up to the first half duration of the sound segment displayed (up to 15s) and the song section with melodic lines closely related to the drone tones. The drone is given by a friction idiophone (Tharisar).
Epic Chant of the Kunkana, sung part segment, duration 3.5 s. The asymetry of the sung part in relation to the drone frequency can easily be detected from the first and 2nd harmonic.
The interdependence of pitch and timbre has been pointed out already in the section on pitch perception. The Yodel-technique of the Bangombe Pygmies elicitates both different modes of pitch perception: virtual pitch and spectral pitch. Two female voices exhibit the following variations:
The interaction between pitch, vowel quality and register change causes
selective amplification of partials in the area of the vowel formant peak
frequency, in the range of the first or 2ndnd partial of the
female voices (633 Hz). The harmonics are sufficiently spaced apart to
be resolved by the ear, producing virtual as well as spectral pitches.
Whenever the fundamental frequency is significantly weaker as the 2ndnd
harmonic, spectral pitch can be perceived by the analytic type of listeners.
At will the perception can be focussed on the fundamental again and a holistic
type of listening occurs.
Lullaby of Bangombe pygmy women (PhA B10840 G.
Kubik, 1965): the peak amplitude contour of the solo part shows the A-B-A
pattern of fundamental /e5-flat/ - 2nd harmonic /b4-flat/ - fundamental
/e5-flat/ and so on. Falsetto tones are marked in diamonds. The inherent
pattern of the upper voice is indicated, starting at 114 s.
The perceptual pitch ambiguity can best be described on the basis of the spectrogram: the peak amplitude of the beginning solo part shows the A-B-A pattern of fundamental /e-flat/ - 2ndnd harmonic /b-flat/ - fundamental /e-flat/ etc. According to the virtual pitch perception /e5-flat/ /b4-flat/ /e5-flat/ has to be perceived whereas subjects following the sepctral pitch hear /e5-flat/ /b5-flat/ /e5-flat/. The spectrogramm clearly shows the fundamental frequency contour. The phenomenon described has been addressed by a number of investigators and in detail by Albrecht (1972). By further analysing the spectrogram a melo-rhythmic pattern in the upper voice (120s to 134s) can be identified; it is aready seen as inherent pattern in the beginning of the solo part starting from the third phrase. The perception of the inherent pattern can be explained by the similarity of timbre of neighbouring tones, the falsetto /f/ and /e-flat/ of phase 3 and the chest voice /c/ /b-flat/ as well as /b-flat/ /g/ of phrase 4. Approximately at location 115s (marked with an asterix) /b4-flat/ is perceived instead of /b5-flat/ which exists objectively. This octave error helps to obtain the continuity of the melody in order to support the good Gestalt. Finally even in parts both voices are in unisono the distinction between the individual voices can easily maintained due to the predominant difference ebtween the chest and falsetto register.
In conclusion and for further studies on that line the spectrogram has been proved as an indespensible basis for the evaluation of complex tonal patterns as represented by the example described.
Lullaby of Bangombe pygmy women: duet. The arrows pointing downward indicate spectral components associated witjh the upper voice. Arrows pointing upward indicate those belonging to lower voice.

continuation of previous spectrogram.
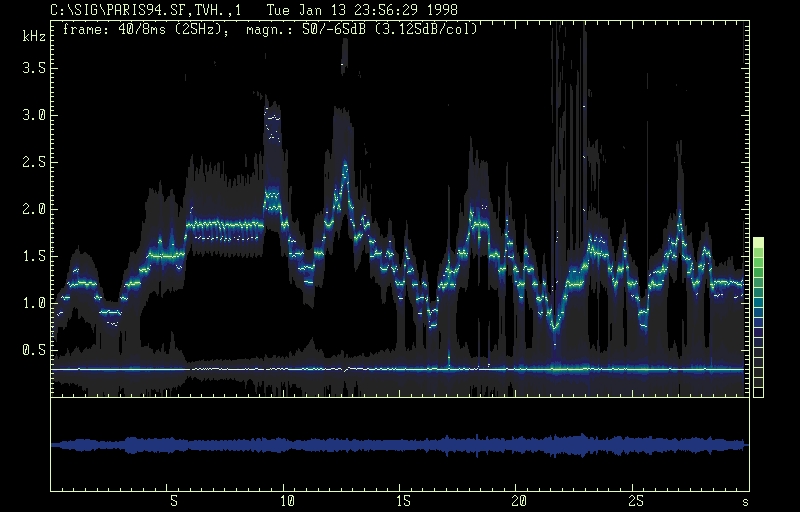
Overtone singing of the nature given by mongolian and turk people (as well as by Tran Quang Hai's reproductive performances) is characterized by (1) a sustained fundamental frequency contour and (2) a melody which is composed from harmonic overtones of that fundamental frequency. The overtone phenomenon has been recognized to be an acoustical factor of the special setting of resonances of the human vocal tract. It has been sufficiently explained by the acoustic theory of voice production (Fant, 1960). Moreover this example shows the coincidence of a production model and the corresponding perception model.
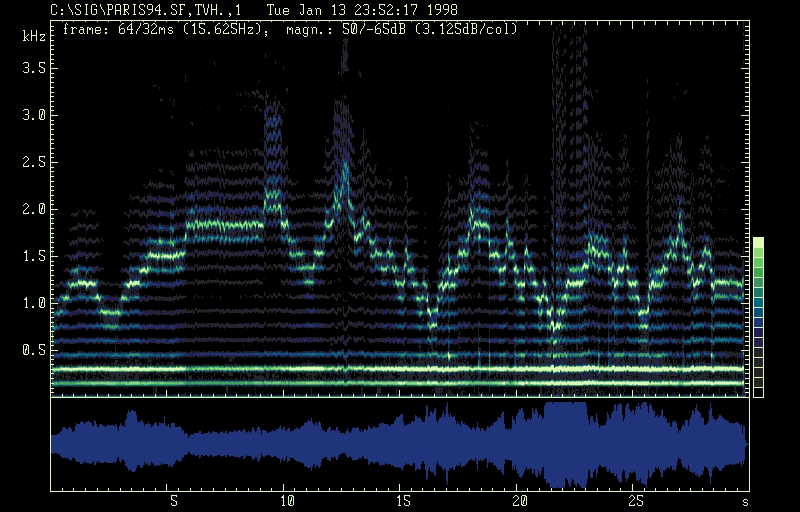
Tran Quang Hai: overtone singing, spectrogram.
The acoustic model of the speech production assumes the glottal spectrum as the primary source for voiced sounds and the vocal tract acting as a filter attached on it: the glottal spectrum consists of a series of harmonics produced by glottal air pulses described in a model according to the myoelastic theory of {Berg (1957)} which has been accepted widely. The slope of the {\em source spectrum} depends on the shape of the individual closing and opening of the vocal folds during one fundamental period; a glottal waveform with more sudden closures produces stronger high frequency harmonics and a sharper timbre or voice quality. The fundamental frequency of the voice is determined by the repetition rate of the glottal pulses which is controlled (1) by the laryngeal musculature affecting the tension and the mass distribution of the vocal chords and (2) by changes of subglottal pressure. Decreased subglottal pressure, reduced mass of the vocal chords and increased tension raise the fundamental frequency.
The tube of the human vocal tract with a length of approximately 17,5 cm is attached on top of the laryngeal section. Its cross section can be changed to wider and narrower constrictions by the walls of the pharynx, the tongue, the jaw opening and the lips. The formant frequencies of vowels are related to the length of the tube and its shape. They represent the resonance frequencies of the vocal tract in non nasalized sounds. When the nasal tract is coupled on, by lowering the soft palate, the amplitude of the vowel formants decreases and a more complex resonace/antiresonace behavior of the vocal tract can be observed. The special setting of overtone singing suppresses the formant frequencies of the normal voice and emphasizes a very small frequency range, as narrow that one partial is amplified only. The result is shown in the spectrograms (fig. 12,13); the fundamental frequency is continuously sounding on one sustained low pitch and the melody is controlled by proper changing of the main resonace frequency. Thus overtone melodies can be played by picking out individual harmonics from the complex tone of the glottal pulse.
Tran Quang Hai: overtone singing. The output of the model of voice production (Linear Prediction Coding, 24 coefficients) extracts the first overtone of the fundamental frequency and the harmonics with the peak amplitude. The overtone melody is produced by setting the vocal tract main resonances accordingly.
The point to be emphasized is that in this case a coincidence of a (voice) production model and the associated perception model can be stablished. Nevertheless it has to be examined from case to case which aspects of the production model can be considered as significant for the perception.
Although these examples are of demonstrative nature only they are consistent with the general concept of introducing acoustics, physiology and psychoacoustics into the process of musical analysis. We have excluded for reasons not outranging the size of this contribution only the very challenging approach of {\em Analysis by Synthesis} as it has been applied in speech research since the beginning of vocoder techniques. Resynthesis of musical sounds can be extremly forceful when appropriate sound analysis data are available. As long as the physical parameters of musical sounds have not been evaluated upon their psychoacoustical effects, the perceptual relevance of individual components of complex sounds can be determined by trial and error only. The introduction of perceptual concepts in the analysis of music yields to results typically much better than would be obtained from acoustics alone.
Aknowledgments
Our special thanks to Prof. Dr. Kreysig for reading the english version of this paper and improving its style.
Albrecht, Erla M. (1972): Das akustische Residuum. Phil. Diss. Univ. Wien.
ANSI S3.20-1973}: American National Standard; Psychoacoustical Terminology. New York.
Bekesy, Georg von (1960): Experiments in Hearing. New York: McGraw-Hill.
Berg, Jw.van den, J.T. Zantema, and P. Doorenbal, Jr. (1957): On the
Air Resistance and the Bernoulli Effect of the Human Larynx. Journal
of the Acoustical Society of America, Vol.29, No.5,p626-631.
Brandl, Rudolf M. (1992): Die Schwebungsdiaphonie im Epiros und verwandte Stile im Lichte der Psychoakustik, in: Schumacher, R. (Hg): von der Vielfalt musikalischer Kultur. Anif 1992:43-79.
Brune, John A. (1981): Piob Mhor und andere britisch-irische Sackpfeifen, in: Schriften zur Volksmusik (Wien, 1981) 41-58.
Collinson, Francis (1970): The traditional and national music of Scotland. London.
Deutsch, W.A. & Anton Noll (1993): Simulation auditorischer Signaltrennung in komplexen musikalischen Signalen durch Übermaskierung. DAGA, Fortschritte der Akustik.
Fant, Gunnar (1970): Acoustic theory of speech production. Mouton, The Hague; 2nd edition.
Fletcher, Harvey (1929): Speech and Hearing. D. van Nostrand Company, Inc. New York.
Fletcher, Harvey (1953): Speech and Hearing in Communication. D. van Nostrand Company, Inc. New York.
Födermayr Franz (1968): Über ein indisches Reibidiophon und die Drone-Praxis, in: Mitteilungen der Anthropologischen Gesellschaft in Wien, 98:75-79.
Födermayr Franz & Werner A. Deutsch (1992): Musik als geistes- und naturwissenschaftliches Problem, in: Gratzer, W. & A. Lindmayr (Hg.), De editione musices. Laaber, 377-389.
Graf, Walter (1963/64): Moderne Klanganalyse und wissenschaftliche Anwendung, in: Schriften des Vereins zur Verbreitung naturwissenschaftlicher Kenntnisse in Wien, 104:43-66. Neudruck in Graf (1980).
Graf, Walter (1980): Vergleichende Musikwissenschaft. Ausgewählte Aufsätze, hg. von F. Födermayr, Wien-Föhrenau.
Helmholtz, Hermann von L.F. (1863): Die Lehre von den Tonempfindungen als physiologische Grundlage für die Theorie der Musik. Vieweg & Sohn, Braunschweig; 6. Aufl. 1913.
Koenig, Walter K., H.K. Dunn, L.Y. Lacey (1946): The Sound Spectrograph. Journal of the Acoustical Society of America, Vol. 18, p. 19-49.
Mac Neill, Seumas and Frank Richardson (1987): Piobreachd and its interpretation. Edinburgh; p.32.
Messner, Gerald F. (1980): Die Schwebungsdiaphonie in Bistrica Tutzing.
Ohm, Georg, Simon (1843): Über die Definition des Tones, nebst daran geknüpfter Theorie der Sirene und ähnlicher tonbildender Vorrichtungen. Annalen der Physik und Chemie, 59, pp. 513-565.
Potter Ralph K., George A. Kopp, Harriet C. Green (1947): Visible Speech. D.van Nostrand Company Inc. New York.
Schouten, J.F. (1940): The perception of subjective tones Proc. Kon. Nederl. Akad. Wetensch. 41, 1086-1093.
Seebeck, A. (1841): Beobachtungen über einige Bedingungen zur Entstehung von Tönen. Annalen der Physik und Chemie, 53; 417-436.
Seebeck, A. (1843): Über die Sirene. Annalen der Physik und Chemie, 60; 449-487.
Terhardt, Ernst (1972): Zur Tonhöhenwahrnehmung von Klängen. II. Ein Funktionsschema. Acustica, Vol 26/4, 187-199.
Zwicker, Eberhard and E. Terhardt (1980): Analytical expression for critical-band rate and critical bandwidth as a function of frequency. JournaL of the.Acoust.Soc.Am. 68(5), Nov. 1980; 1523-1525.