Settings Dialog
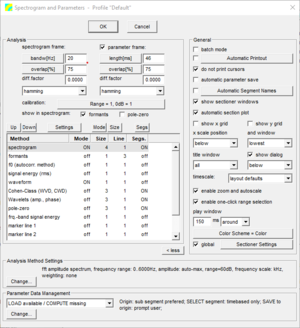
This is the setup and start dialog for the Spectrogram & Parameters Viewer, also known as Analysis in the Compact mode. This application shows a selected set of transformations and parameters of the source signals. It also implements a spectrum sectioner and some segmentation tools.
Contents
- 1 Dialog Layout
- 2 Control Buttons
- 3 Source Signal
- 4 Analysis
- 5 Calibration
- 6 General
- 6.1 batch mode
- 6.2 Automatic Printout
- 6.3 do not print cursors
- 6.4 automatic parameter save
- 6.5 Automatic Segment Names
- 6.6 show sectioner windows
- 6.7 automatic sectioner plot
- 6.8 show x grid, show y grid
- 6.9 x scale position and window
- 6.10 title window
- 6.11 show dialog
- 6.12 timescale
- 6.13 enable zoom and autoscale
- 6.14 enable one-click range selection
- 6.15 play window
- 6.16 Color Scheme
- 6.17 global
- 7 Method list
- 8 Parameter Data Management
Dialog Layout
At the top of the dialog window the control buttons and the controls for the source signal selection are located. Below the source signal controls the controls for the application settings are displayed in two groups. On the left side are the settings for the three plot regions zoom, segment lines and overview and on the right side are the general settings and some buttons for sub-dialogs.
Control Buttons
- Start
- Save settings into the profile displayed in the dialog caption, close the dialog and start the application. This button is only displayed if one or more signals are selected in the Overview or Detail window of the Workspace. If multiple signals are selected, for each signal a separate application is started.
- OK
- Save settings into the profile displayed in the dialog caption and close the dialog, but do not start the application.
- Cancel
- Close the dialog without saving the changes.
Note: The Start button is only displayed if a valid object is selected in the Workspace (e.g. a segment or sound file).====Source Signal====
Source Signal
- Set
- Shows the XML-reference (IRef) of the audio-set containing the source signal
- Seg
- Contains the ID of the selected segment or the address (task-expression) of the source signal. This field can be edited.
- Chn.
- Source signal channel (All, 1, 2, ...). The contents of the combobox depend on the number of channels of the audio-set.
Note: If multiple source signals are selected, only the number of selected signals (on the left side) and the Chn.-selection is displayed, the Set- and Seg-controls are hidden.
Analysis
The following Spectrogram & Parameters Viewer settings are specific to the signal analysis.
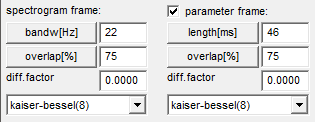
spectrogram frame
This group of controls below this text is used to define the frame parameters for the spectrogram analysis.
bandwidth/length
This button selects the unit of the frame length. To change the unit, press the button. The available settings are length[smpl] (framelength in samples), length[ms] (framelength in milliseconds) and bandw[Hz] (bandwidth in Hertz). The edit field on the right side contains the value of the framelength which must be greater than zero.
overlap/shift
This button selects the type and unit of the frame shift or overlap. Press the button to change it. The available settings are shift[smpl] (shift in sampled), shift[ms] (shift in milliseconds) and overlap[%] (overlap in percent of the framelength). The edit field on the right side contains the shift/overlap value. Shift values must be greater than zero and lower or equal to the framelength and the overlap value must be in the range 0 to 99 percent.
diff. factor
Differentiation factor. If greater than zero (and lower or equal 1) differentiation is applied to the signal before analysis.
kaiser-bessel(8)
This button selects the windowing function which should be applied to the signal. Press the button to change the window function type. The available windows are rectangle, Hanning, Hamming, Blackman-Harris, Kaiser-Bessel (with to different factors) and Bartlett.
parameter frame
If checked, separate frame settings for the parameter analysis methods can be defined. Otherwise the same settings as for the spectrogram frame are used. See spectrogram frame (above) for the meaning of frame settings.
waveform range / 0db
Waveform amplitude value for full attenuation (range) and zero dB (0dB=). Both values must be greater than zero.
show in spectrogram: formants / pole-zero
If checked, the formant tracks (method: formants) and/or pole-zero tracks (method: pole-zero) are plotted over the spectrogram, rather than in their own graph. The scale and unit settings of the spectrogram are used instead of the formant/pole-zero scale and unit.
Calibration
You can set the profile's calibration settings using the calibration parameters dialog.
General
The following general settings are available:
batch mode
If checked, the analysis application is closed automatically when finished. This option can only be used if automatic printout and/or automatic parameter save is enabled.
Automatic Printout
If checked, the printout of the waveform plot is started automatically and the application is closed when the printout is finished. The button starts the print settings dialog.
do not print cursors
If checked, the cursors are not printed. This option works only for the automatic printout.
automatic parameter save
If checked, the computed parameters (but not the spectrogram) are automatically saved. Older versions of same parameter methods computed for the analysed segment are replaced. This checkbox is only enabled if the Parameter Data Management is set to 'COMPUTE always'.
Automatic Segment Names
If checked, the id of new segments is assigned automatically. The format of the automatic name depends on the settings of the Automatic Segment Names dialog, which can be opened with this button.
show sectioner windows
Enable / disable the sectioner windows. If enabled, the sectioner windows are shown on top of the analysis display.
automatic sectioner plot
Enable / disable automatic sectioner update. If enabled, the sectioner windows are updated every time a time scale cursor is selected or moved. Otherwise the user must press the function key F8 to update the sectioner.
show x grid, show y grid
Enable/disable the grid on the x/y-scales of the all graphs. This setting is not applied to the sectioner windows, which have their own grid settings.
x scale position and window
Selects the position (below or above graph) and window (none, lowest, highest or all) where the x-scale (time) should be displayed.
title window
Selects the graph (none, lowest, highest or all), where the analysis title (audio-set, segment and channel) should be displayed.
show dialog
Show / hide the analysis application control dialog and select the dialog position (below or above graph windows)
timescale
Choose the timescale to use on the x-axis. The clock setting displays the time in hours, minutes, seconds and milliseconds from the beginning of the displayed segment (E.g. 0:01:00.000 which means 1 minute from the beginning of the displayed segment). If layout-defaults is specified, the timescale set in the Display Layout and Format dialog is used.
enable zoom and autoscale
If checked, then the zoom and autoscale features are turned on.
enable one-click range selection
If checked, you can set a new cursor range by clicking anywhere in the graph, dragging and letting go. This can make selecting a cursor range very easy. However, if you prefer to be able to change the cursor range only by selecting a cursor and dragging it, please disable this check box.
play window
The size of the window to be played when the 'play window' hotkey is pressed. The signal before, around or after the active cursor is played.
Color Scheme
With this button the Color Scheme and Settings dialog is opened to select and/or configure the plot colors, line styles and general graphics settings. The selected color scheme is displayed in the button caption.
global
If checked, then the sectioner settings are global to STx. If unchecked, then these settings are saved with this profile. This can be specified per profile. Note that if you export a profile, the sectioner settings are only exported if global settings are unchecked.
Method list
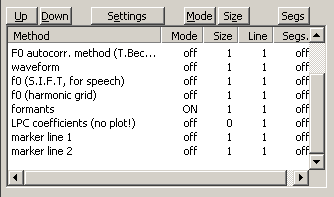
The method list is where you specify which analysis methods to use in the profile and modify their settings. The Spectrogram & Parameters Viewer currently supports these methods.
Methods
You can analyse the signal with a variety of methods. More details here.
Up/Down
Reposition the graph within the display by moving it up or down.
Settings
Open a settings dialog for the selected method (click on the method name in the method list to select it).
Mode
Whether a method is used in a profile is determined by its mode: ON or OFF. Double-click a method to toggle its mode.
Size
The Size column specifies the size of the method. The size is the method's graph size in relation to the other method graphs. If all methods have a size of 1, then they will all be the same height. If one method has a size of 2, it will be double the height of the methods with a size of 1.
Line
The value in the Line column specifies which function line color (see Color Schemes) to use to draw the method's function. You can change the line value by right-clicking on the method and selecting the context menu item line.
Segs
The Segs column indicates if segments will be displayed in the graphs or not. You can turn segments on and off via the context menu item Segments -> On / Off. You can modify how and where segments are drawn by pressing the Segs button, which opens the Segment Markers Dialog.
Parameter Data Management
Choose whether parameters are computed or loaded on analysis.
- COMPUTE always - computes the parameters on analysis, even if parameters already exist (i.e. old parameters are overwritten).
- LOAD available / COMPUTE missing - loads the parameters if they exist and computes those which are missing.
- LOAD available / DISABLE missing - loads the parameters which exist, and does not draw those parameters which are missing. This setting does not work well with super segments and sub segments, since they will not be loaded if the segment itself has no parameter data.
Parameter IO Configuration
If you choose to load existing parameters, you have the choice of loading super or sub segment parameters in addition or instead. A super segment is a segment which starts before and ends after another segment. A sub segment is a segment which starts after and ends before another segment. This feature was introduced in STx 4.3.
Load
You can choose to load parameter data from super or sub segments as well as from the segment itself. This is done by selecting one of the following:
| own data only | parameter data is loaded from the selected segment. |
| super segment data only | parameter data is loaded from the super segment if one is found, otherwise no parameter data is loaded. |
| super segment data (preferred) or own data | parameter data is loaded from the super segment if one is found, otherwise parameter data is loaded from the selected segment. |
| sub segment data only | parameter data is loaded from sub segments, if found, otherwise no parameter data is loaded. |
| sub segment data (preferred) or own data | parameter data is loaded from sub segments if any are found. If no sub segments are found, then the selected segments parameter data is loaded. |
Save
If you have loaded sub or super parameters, and you choose to save the parameter, you can choose one of the following for saving the loaded super/sub data:
| always overwrite origin data | the parameter data loaded will always be overwritten, if the user chooses to save the selected parameter (or has automatic parameter saving turned on). |
| prompt user | the user will be prompted to choose whether they wish to save the loaded sub/super parameter data. |
| never overwrite origin data | the loaded super/sub parameter data will never be overwritten. |
TODO: allow user to specify if selected segment parameters are saved. Currently it is always overwritten.
Select
Here you can define how super or sub segments get selected.
| timebased (shortest super / longest sub) | The shortest segment enclosing the selected segment will be chosen as the super segment or the longest sub segment within the selected segment will be chosen as the sub segment. |
| timebased + wildcard ID | In addition to finding either the shortest super segment, or the longest sub segment, the ID of the segment must match the wildcard ID. Simple wildcard matching using an asterisk for any number of characters and a question mark for on character. |
| timebased + find expression | In addition to finding either the shortest super segment or the longest sub segment, a find expression can be specified, filtering the segments according to their attributes. E.g. you could only consider segments with the attribute Spk:==:m1.
|


